pprof、线上内存泄露分析、prometheus、pyroscope、grafana
一、系统自带工具 :pprof
go中提供了pprof包来做代码的性能监控,在两个地方有包:
- net/http/pprof
- runtime/pprof
其实net/http/pprof中只是使用runtime/pprof包来进行封装了一下,并在http端口上暴露出来。
使用 net/http/pprof 做WEB服务器的性能监控
import _ “net/http/pprof”
然后就可以在浏览器中使用http://localhost:port/debug/pprof/ 直接看到当前web服务的状态,包括CPU占用情况和内存使用情况等。
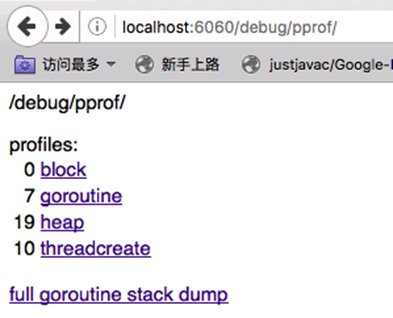
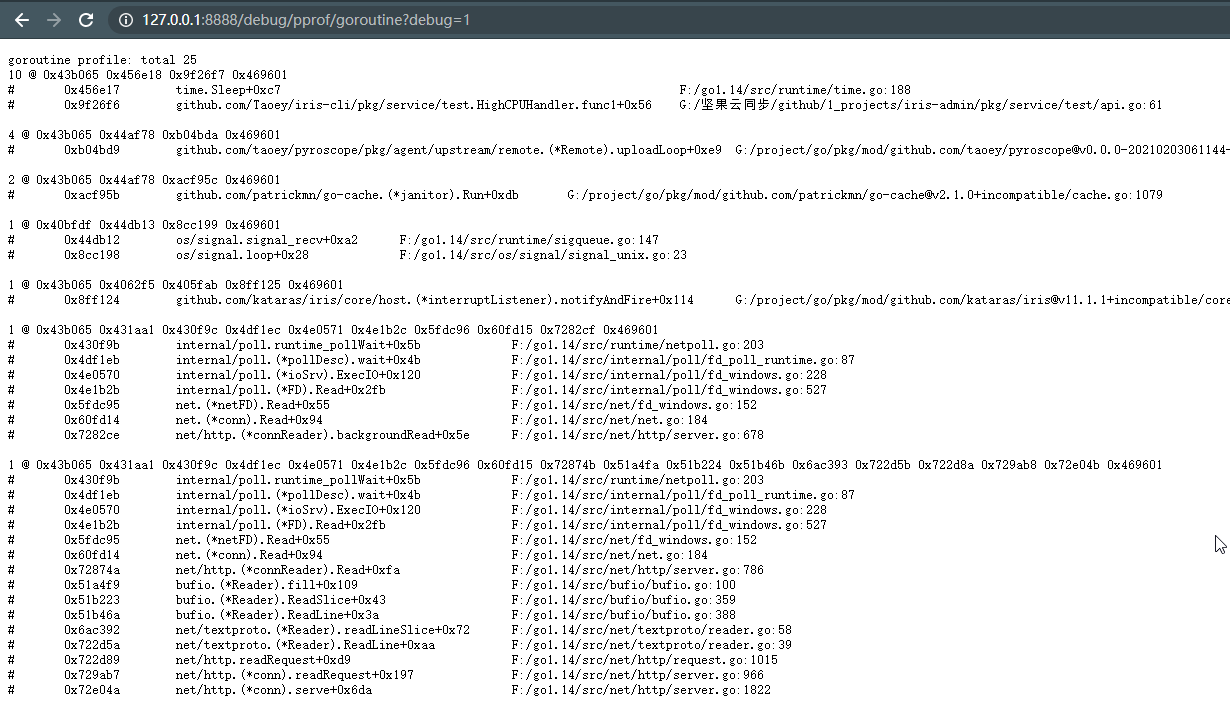
1、堆栈信息
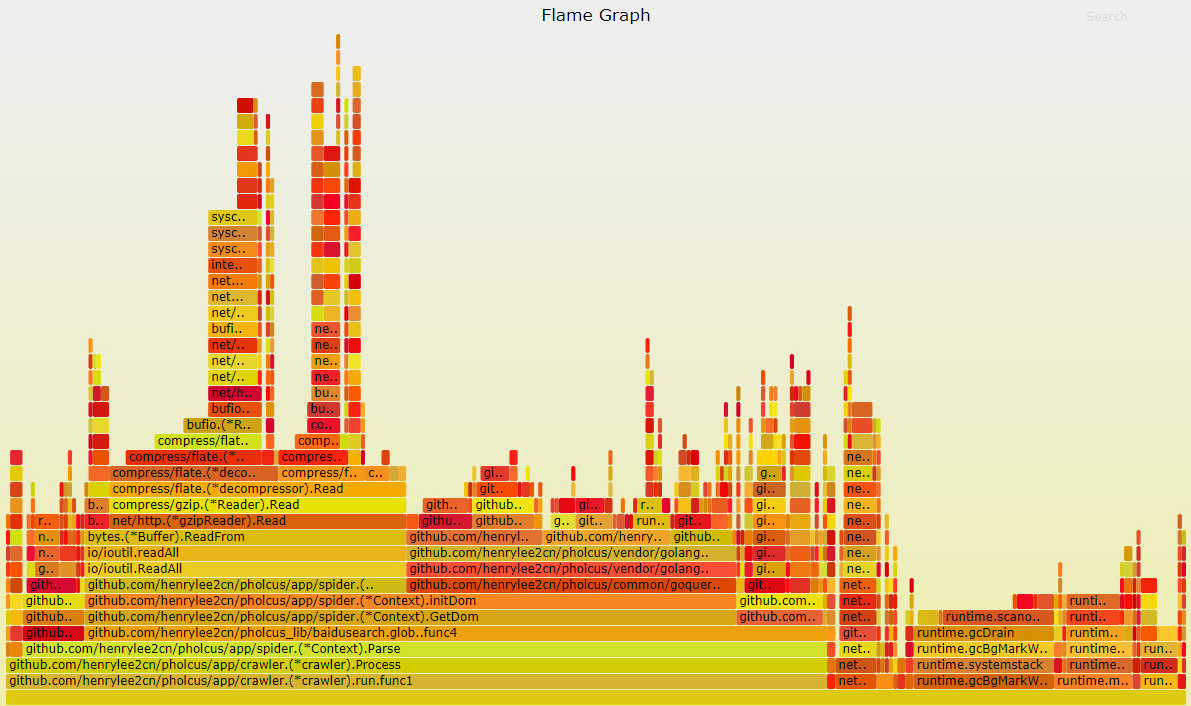
2、火焰图
火焰图横轴的长度代表执行的时间,横轴越长执行时间越长,
纵轴代表代码的调用栈
3、goroutine信息
4、线上内存泄露分析
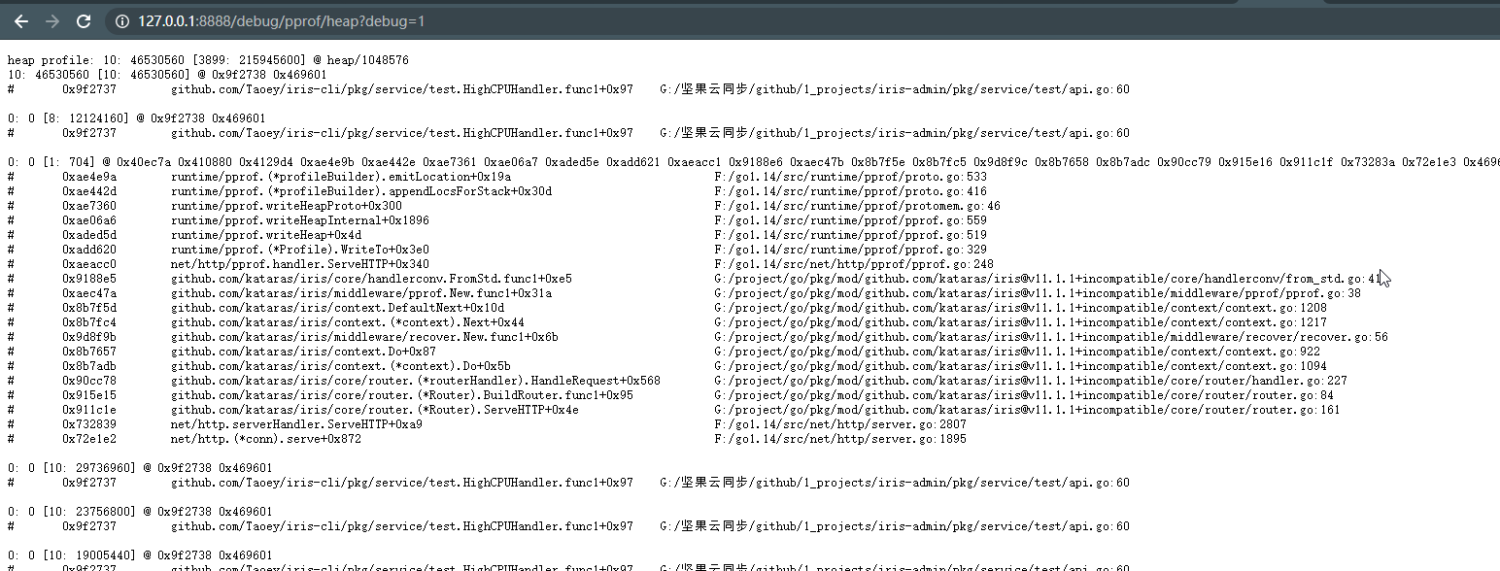
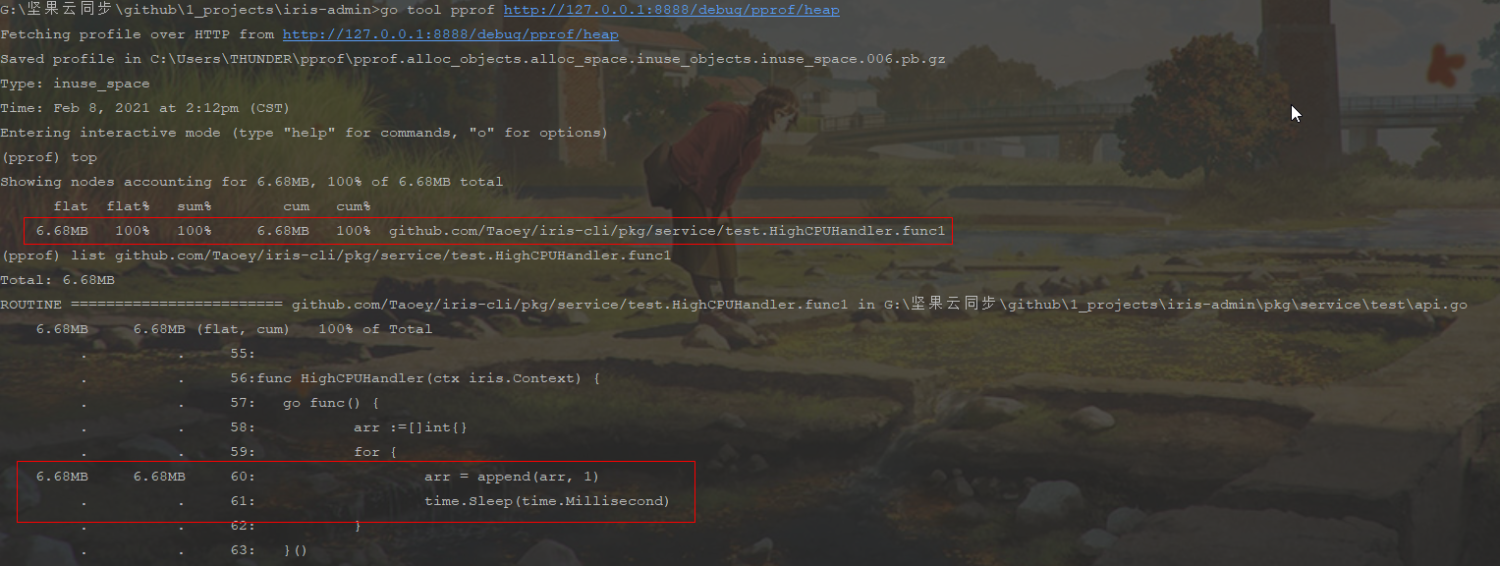
使用go tool pprof 进入交互命令行
# 进入内存分析,命令行交互
go tool pprof http://{ip}:{port}/debug/pprof/heap

# 查看前10 内存占用
top
# 查看某一函数具体的内存占用
list github.com/Taoey/iris-cli/pkg/service/test.HighCPUHandler.func1
二、第三方加强工具
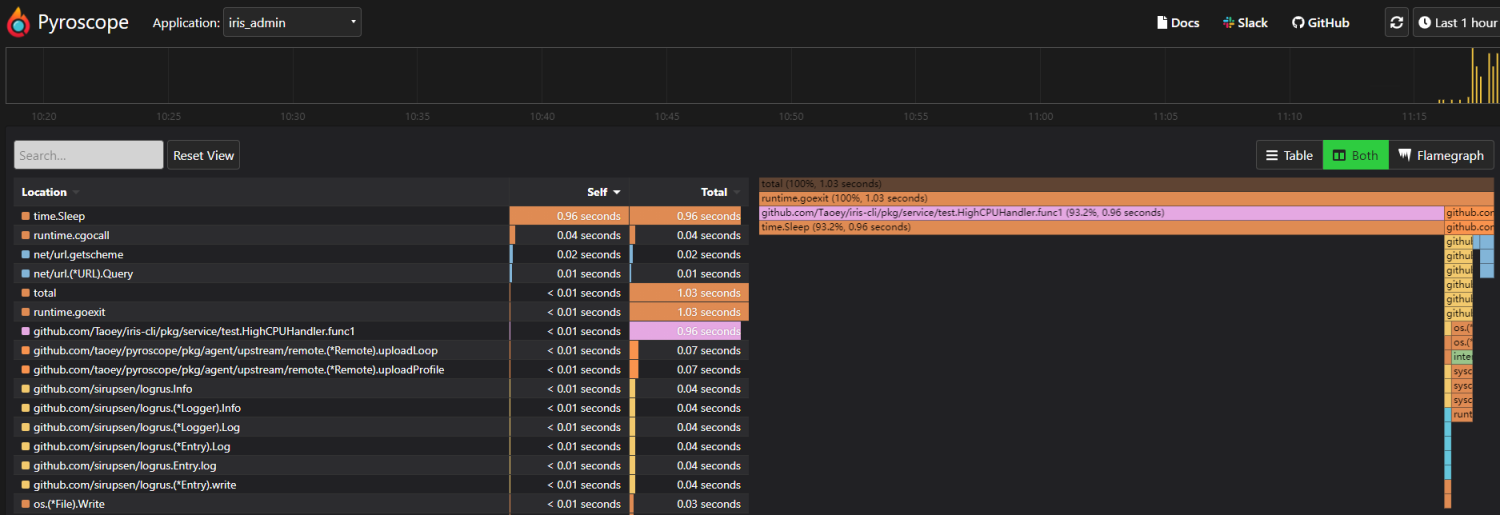
1、开发压测利器:pyroscope + ab
进行后端业务接口开发时,在保证业务逻辑正确的同时,也应关注代码的性能,我们当然可以使用benchmark测试及生成火焰图来进行测试,但是在开发时,这种方式不够便捷,pyroscope 可以生成实时CPU火焰图,用于观察接口CPU的使用情况,结合linux ab压测工具,能快速便捷的找到低性能代码,同时结合benchmark,用于做优化前后的详细性能对比
下图为模拟高CPU操作的函数测试图:
安装及使用
pyroscope文档
- github地址:https://github.com/pyroscope-io/pyroscope
- 快速开始:https://pyroscope.io/docs/
ab压测工具:https://blog.csdn.net/u011415782/article/details/78501799
根据https://pyroscope.io/docs/ 我们可以轻易在系统中集成pyroscope,本文使用docker方式进行安装:
# 拉取镜像
docker pull pyroscope/pyroscope:latest
# 运行镜像
docker run -it -p 4040:4040 pyroscope/pyroscope:latest server
在go代码中集成pyroscope:
package main

import "github.com/pyroscope-io/pyroscope/pkg/agent/profiler"

func main() {
  profiler.Start(profiler.Config{
        ApplicationName: "backend.purchases",
        ServerAddress:   "http://localhost:4040",
    })

  // your code goes here
}
2、企业化监控解决方案:prometheus + grafana
参考资料:
- https://www.cnblogs.com/chenqionghe/p/10494868.html
- https://www.cnblogs.com/fatyao/p/11007357.html
- http://studyiris.com/example/exper/prometheus.html
(1) Prometheus的特点
- 多维度数据模型。
- 灵活的查询语言。
- 不依赖分布式存储,单个服务器节点是自主的。
- 通过基于HTTP的pull方式采集时序数据。
- 可以通过中间网关进行时序列数据推送。
- 通过服务发现或者静态配置来发现目标服务对象。
- 支持多种多样的图表和界面展示,比如Grafana等。
官网地址:https://prometheus.io/
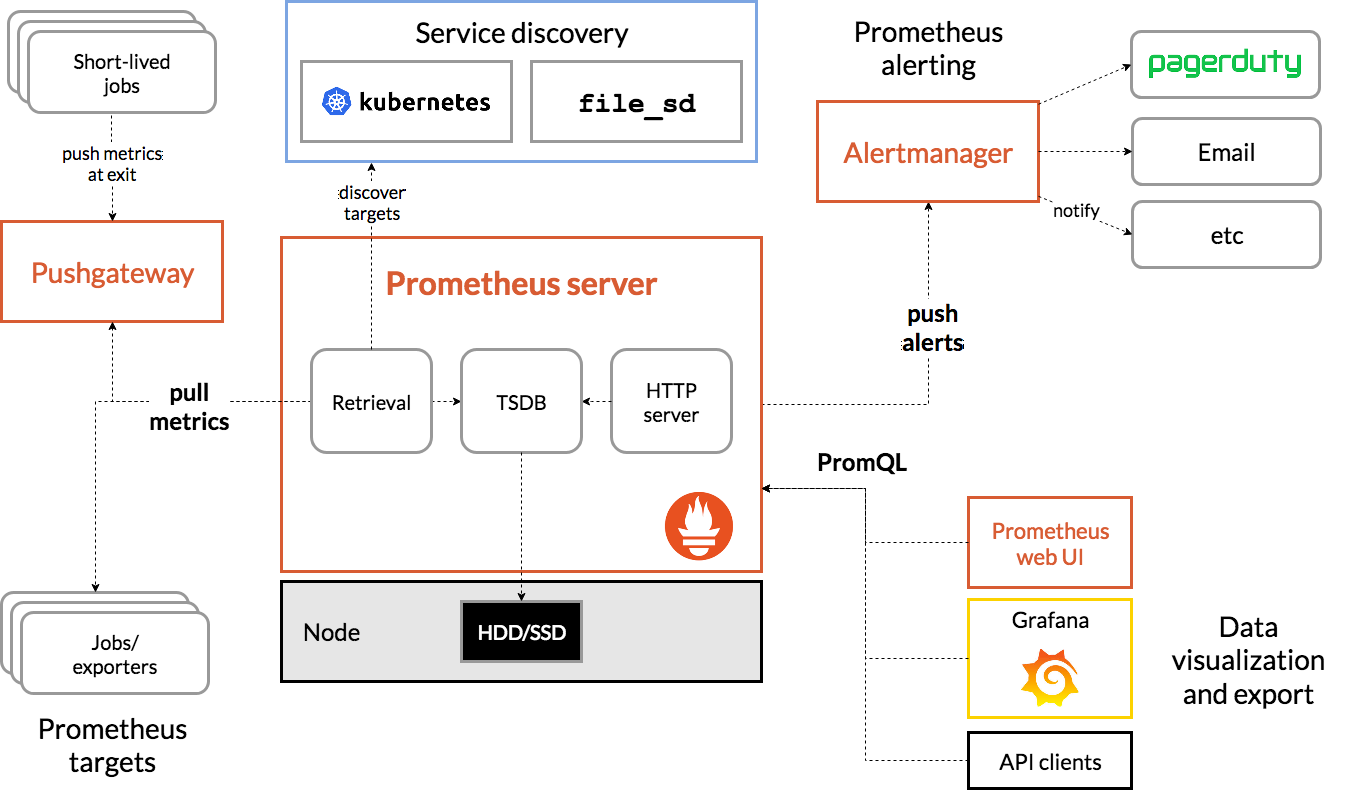
(2) 架构图
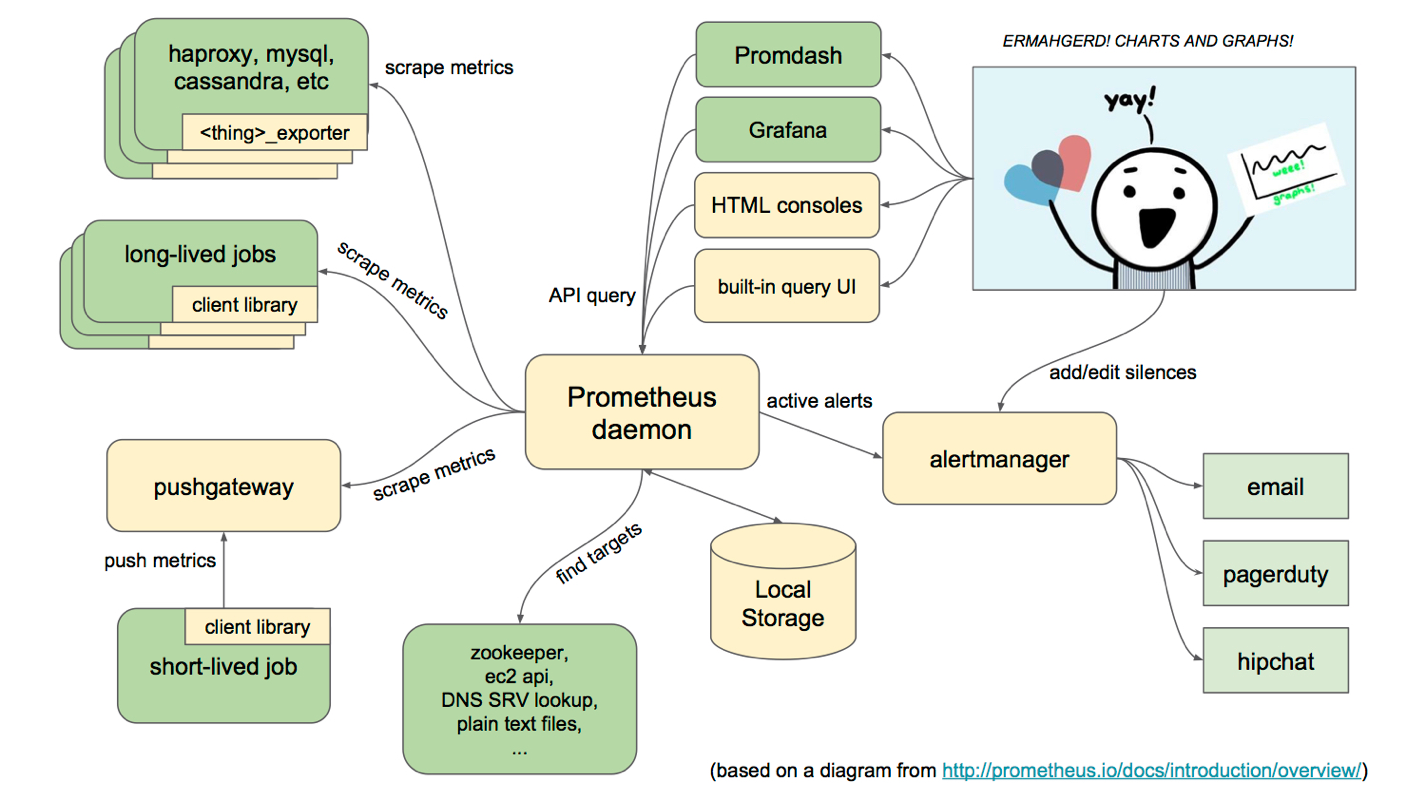
(3) 基本原理
Prometheus的基本原理是通过HTTP协议周期性抓取被监控组件的状态,任意组件只要提供对应的HTTP接口就可以接入监控。不需要任何SDK或者其他的集成过程。这样做非常适合做虚拟化环境监控系统,比如VM、Docker、Kubernetes等。输出被监控组件信息的HTTP接口被叫做exporter 。目前互联网公司常用的组件大部分都有exporter可以直接使用,比如Varnish、Haproxy、Nginx、MySQL、Linux系统信息(包括磁盘、内存、CPU、网络等等)。
(4) 服务过程
- Prometheus Daemon负责定时去目标上抓取metrics(指标)数据,每个抓取目标需要暴露一个http服务的接口给它定时抓取。Prometheus支持通过配置文件、文本文件、Zookeeper、Consul、DNS SRV Lookup等方式指定抓取目标。Prometheus采用PULL的方式进行监控,即服务器可以直接通过目标PULL数据或者间接地通过中间网关来Push数据。
- Prometheus在本地存储抓取的所有数据,并通过一定规则进行清理和整理数据,并把得到的结果存储到新的时间序列中。
- Prometheus通过PromQL和其他API可视化地展示收集的数据。Prometheus支持很多方式的图表可视化,例如Grafana、自带的Promdash以及自身提供的模版引擎等等。Prometheus还提供HTTP API的查询方式,自定义所需要的输出。
- PushGateway支持Client主动推送metrics到PushGateway,而Prometheus只是定时去Gateway上抓取数据。
- Alertmanager是独立于Prometheus的一个组件,可以支持Prometheus的查询语句,提供十分灵活的报警方式。
(5) 三大套件
- Server 主要负责数据采集和存储,提供PromQL查询语言的支持。
- Alertmanager 警告管理器,用来进行报警。
- Push Gateway 支持临时性Job主动推送指标的中间网关。
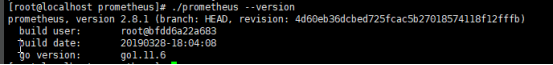
(6) 安装prometheus
wget https://github.com/prometheus/prometheus/releases/download/v2.8.1/prometheus-2.8.1.linux-amd64.tar.gz
tar -zxvf prometheus-2.8.1.linux-amd64.tar.gz -C /usr/local/
cd /usr/local
mv prometheus-2.8.1.linux-amd64/ prometheus
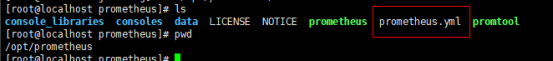
cd prometheus/
./prometheus --version
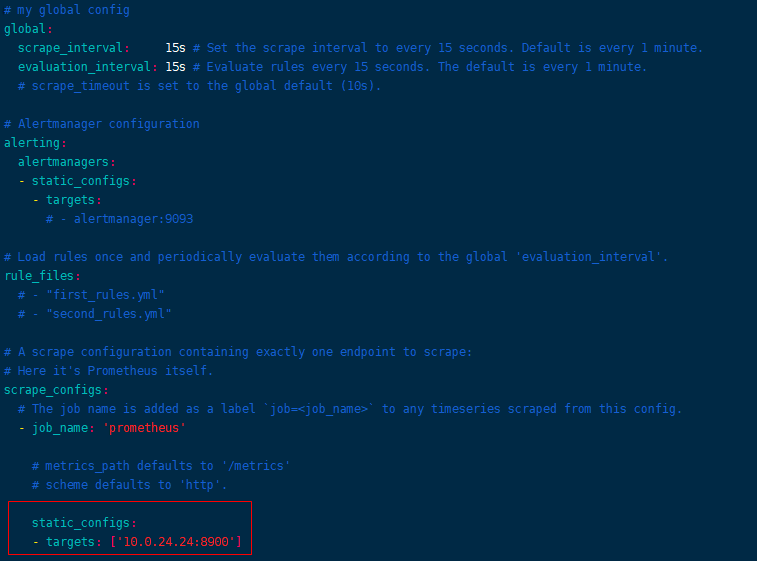
修改prometheus.yml文件,确定启动ip, 注意:targets为待监控服务器的ip和port
完成修改后,可以直接启动
./prometheus
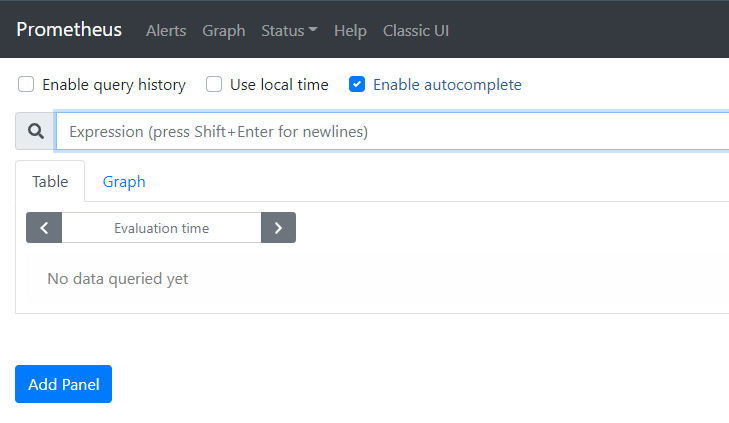
之后打开9090端口,即可查看对应的web界面
(7) 适配web框架 iris
http://studyiris.com/example/exper/prometheus.html
可以直接查看官网给出的例子:整体思路为对外暴露一个”metrics”接口
https://github.com/iris-contrib/middleware/blob/master/prometheus/_example/main.go
package main

import (
    "math/rand"
    "time"

    "github.com/kataras/iris/v12"

    prometheusMiddleware "github.com/iris-contrib/middleware/prometheus"
    "github.com/prometheus/client_golang/prometheus/promhttp"
)

func main() {
    app := iris.New()
    m := prometheusMiddleware.New("serviceName", 0.3, 1.2, 5.0)

    app.Use(m.ServeHTTP)

    app.OnErrorCode(iris.StatusNotFound, func(ctx iris.Context) {
        // error code handlers are not sharing the same middleware as other routes, so we have
        // to call them inside their body.
        m.ServeHTTP(ctx)

        ctx.Writef("Not Found")
    })

    app.Get("/", func(ctx iris.Context) {
        sleep := rand.Intn(4999) + 1
        time.Sleep(time.Duration(sleep) * time.Millisecond)
        ctx.Writef("Slept for %d milliseconds", sleep)
    })

    app.Get("/metrics", iris.FromStd(promhttp.Handler()))

    // http://localhost:8080/
    // http://localhost:8080/anotfound
    // http://localhost:8080/metrics
    app.Listen(":8080")
}
(8) 安装grafana展示
Grafana是用于可视化大型测量数据的开源程序,它提供了强大和优雅的方式去创建、共享、浏览数据。
Dashboard中显示了你不同metric数据源中的数据。
Grafana最常用于因特网基础设施和应用分析,但在其他领域也有用到,比如:工业传感器、家庭自动化、过程控制等等。
Grafana支持热插拔控制面板和可扩展的数据源,目前已经支持Graphite、InfluxDB、OpenTSDB、Elasticsearch、Prometheus等。
我们使用docker安装
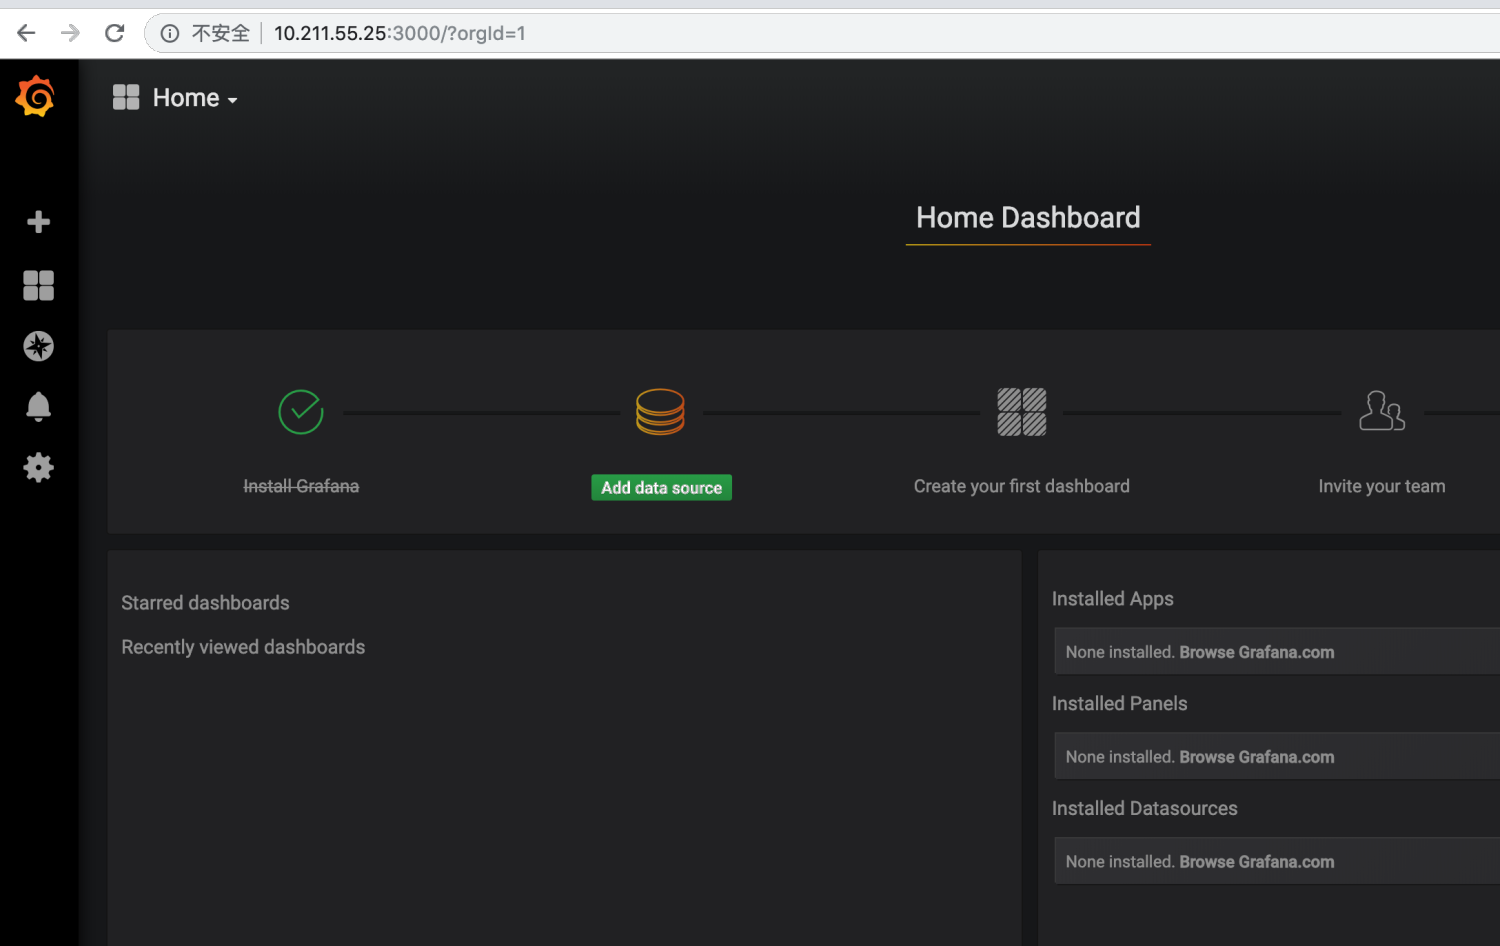
docker run -d -p 3000:3000 --name grafana grafana/grafana
默认登录账户和密码都是admin,进入后界面如下
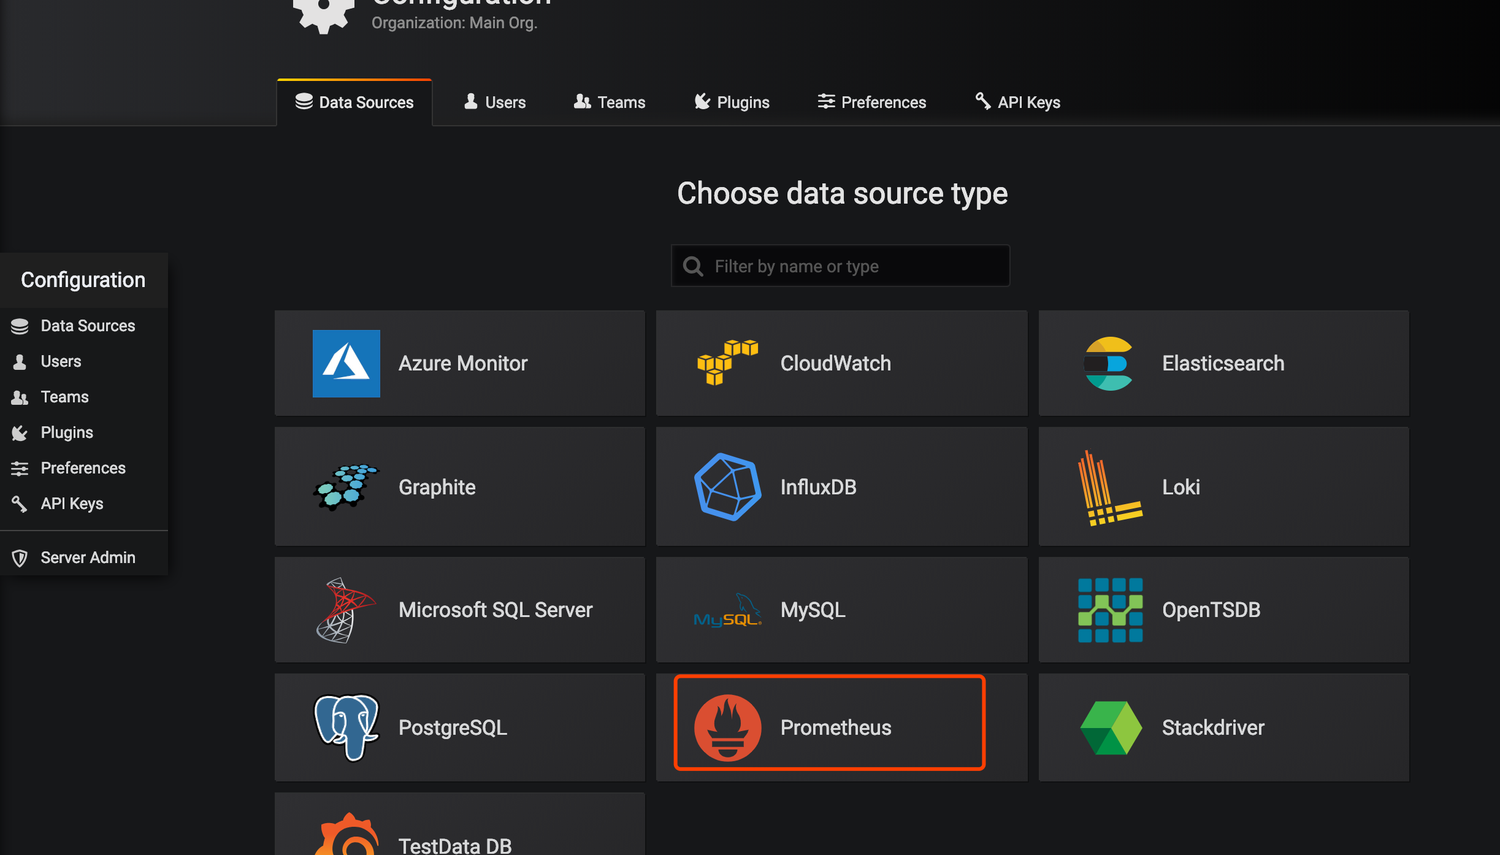
我们添加一个数据源
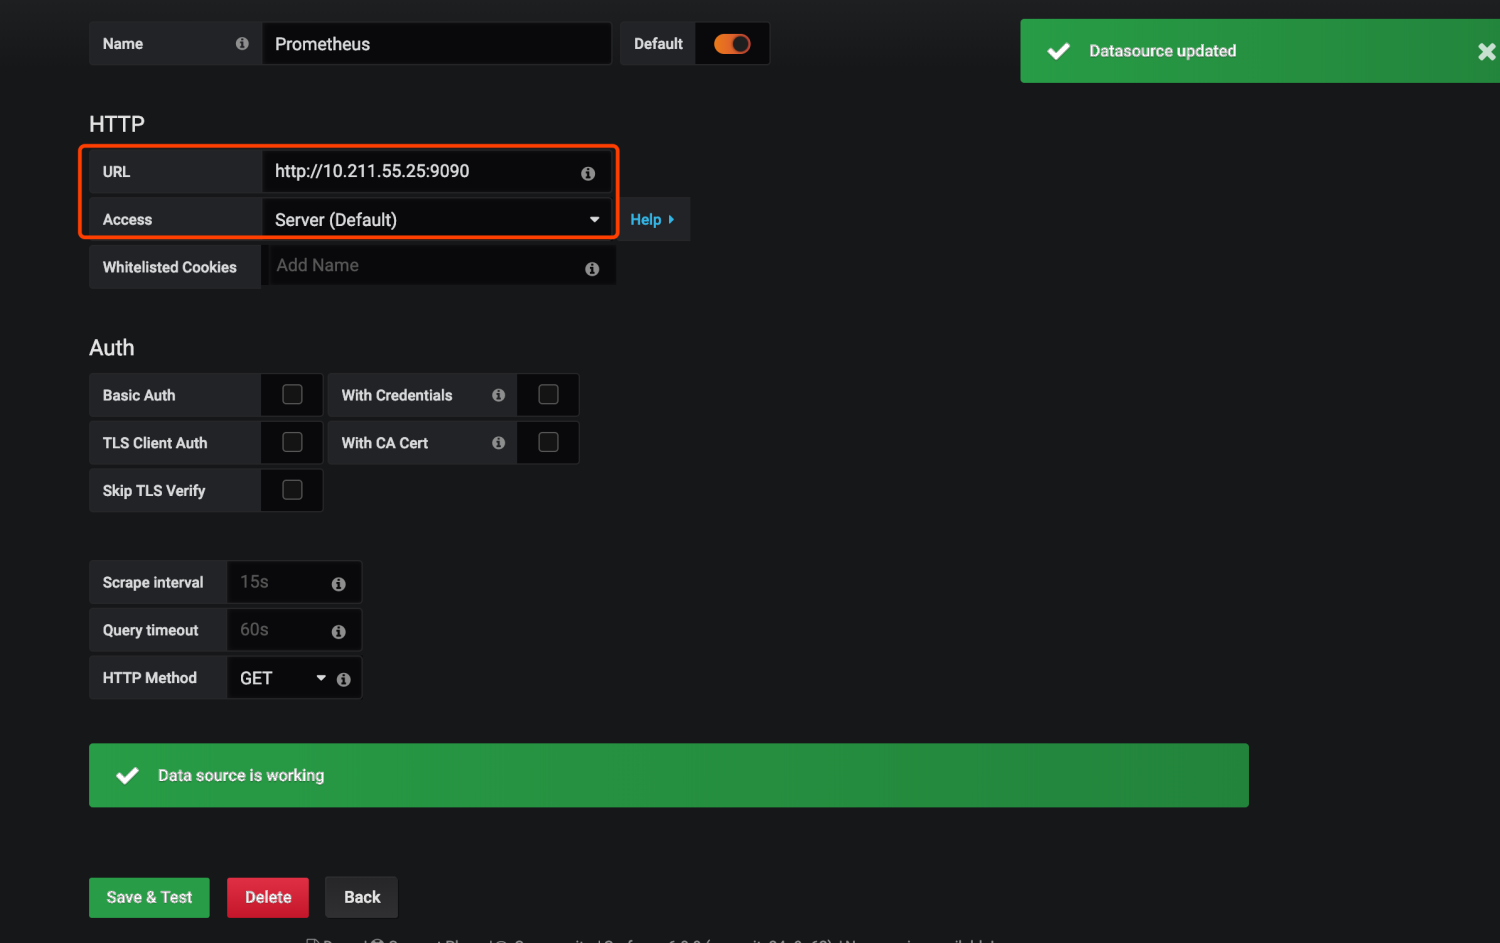
把Prometheus的地址填上
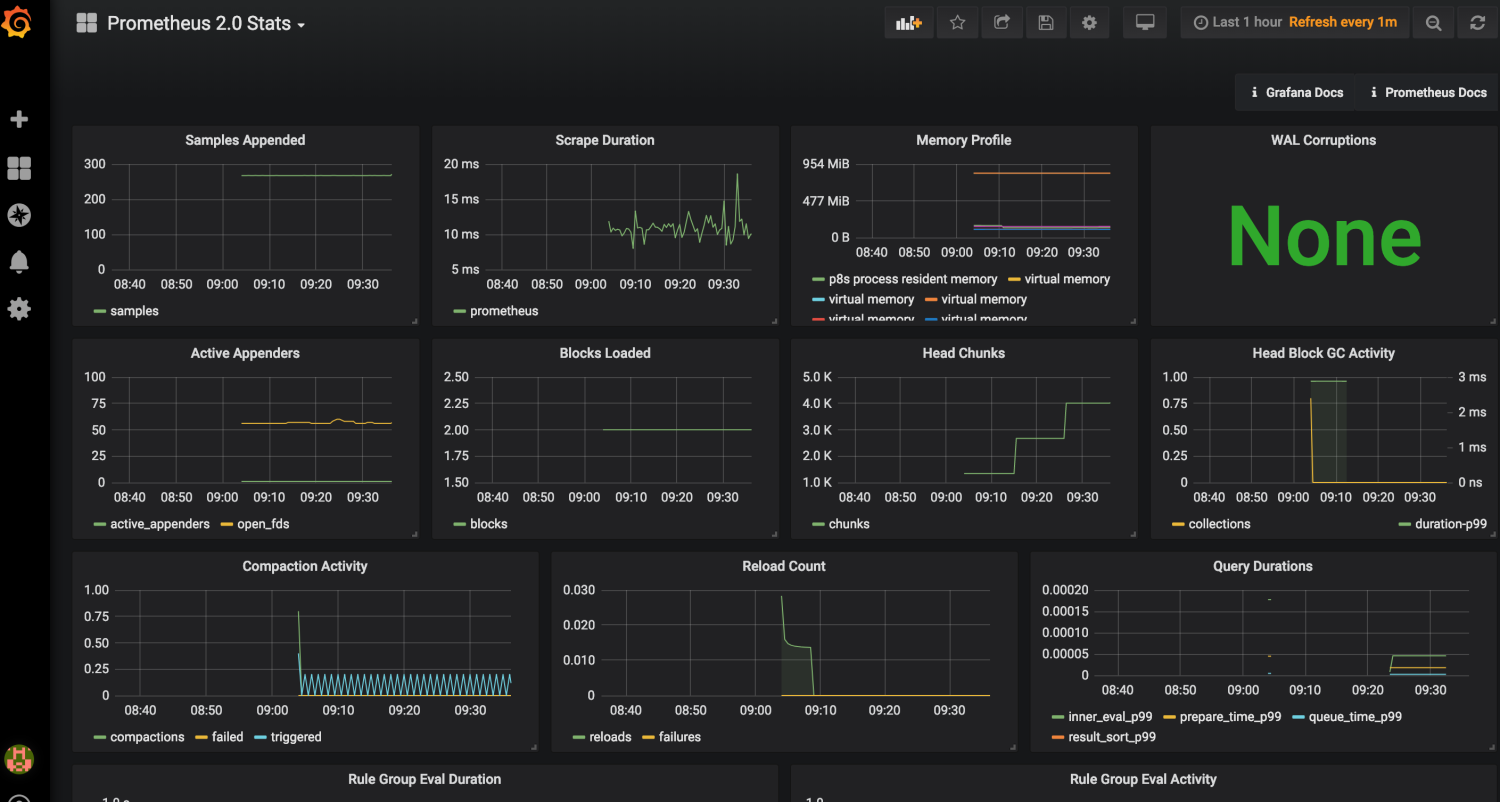
导入prometheus的模板
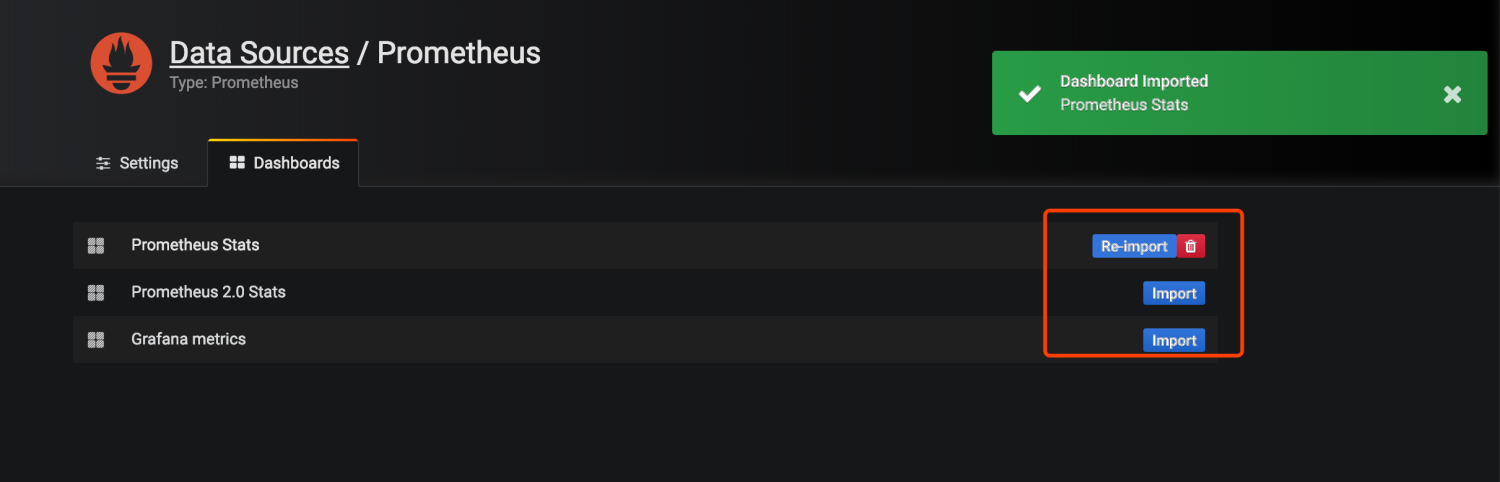
打开左上角选择已经导入的模板会看到已经有各种图
我们来添加一个自己的图表
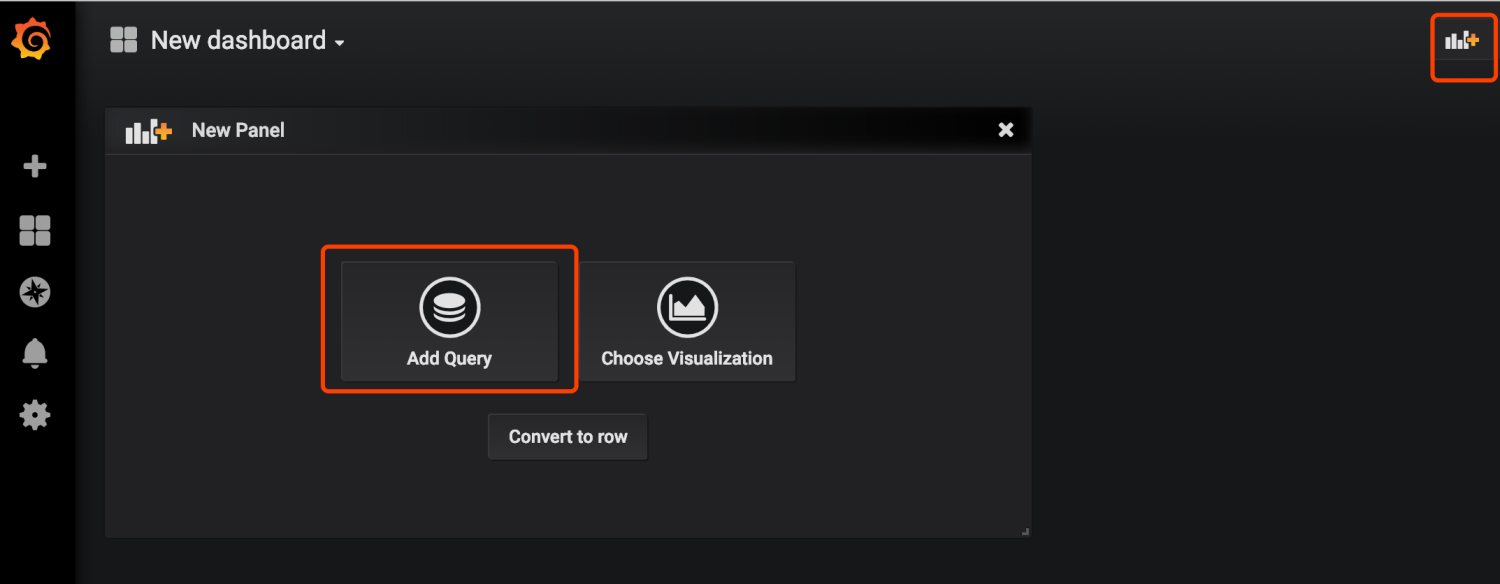
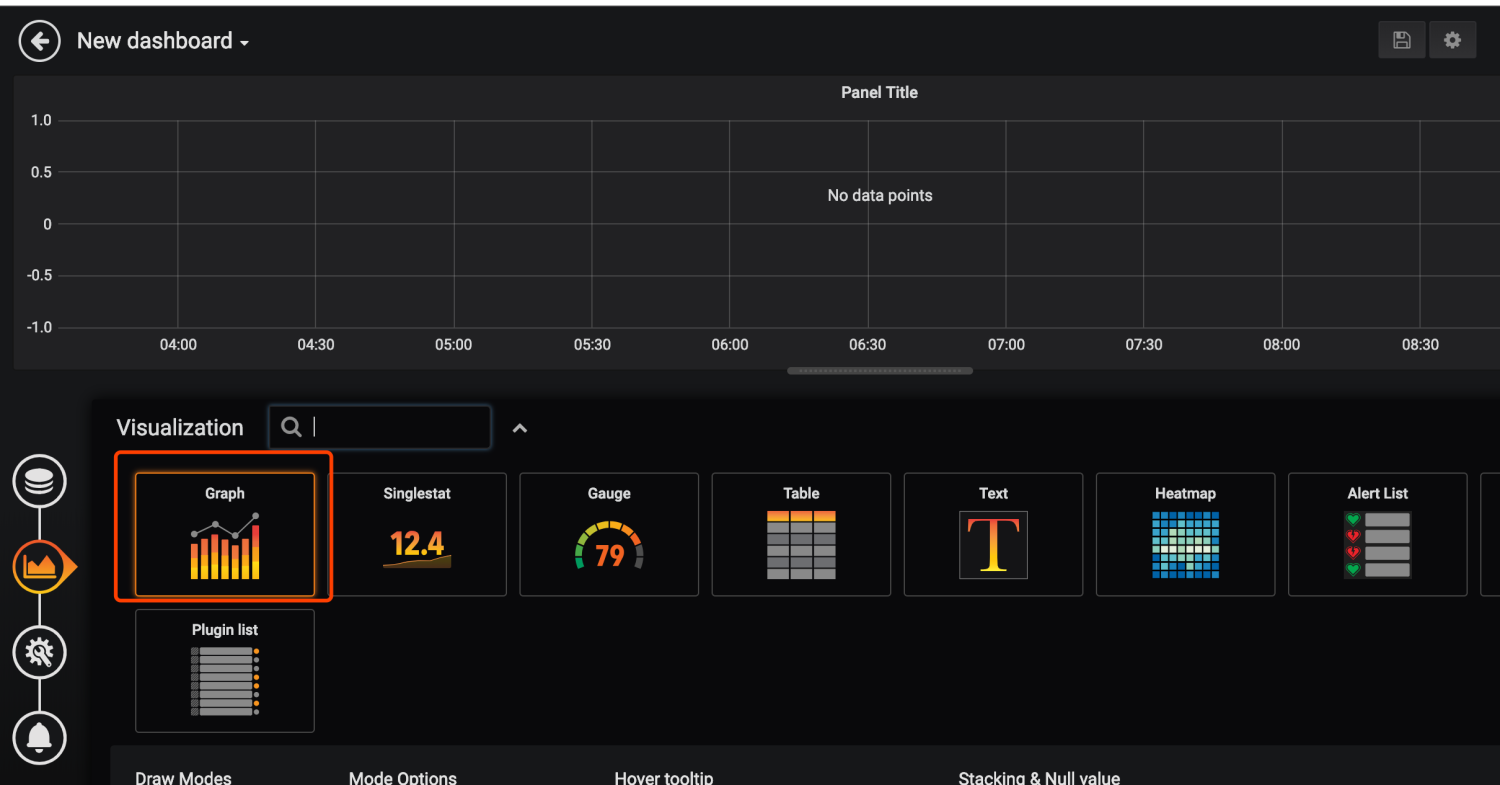
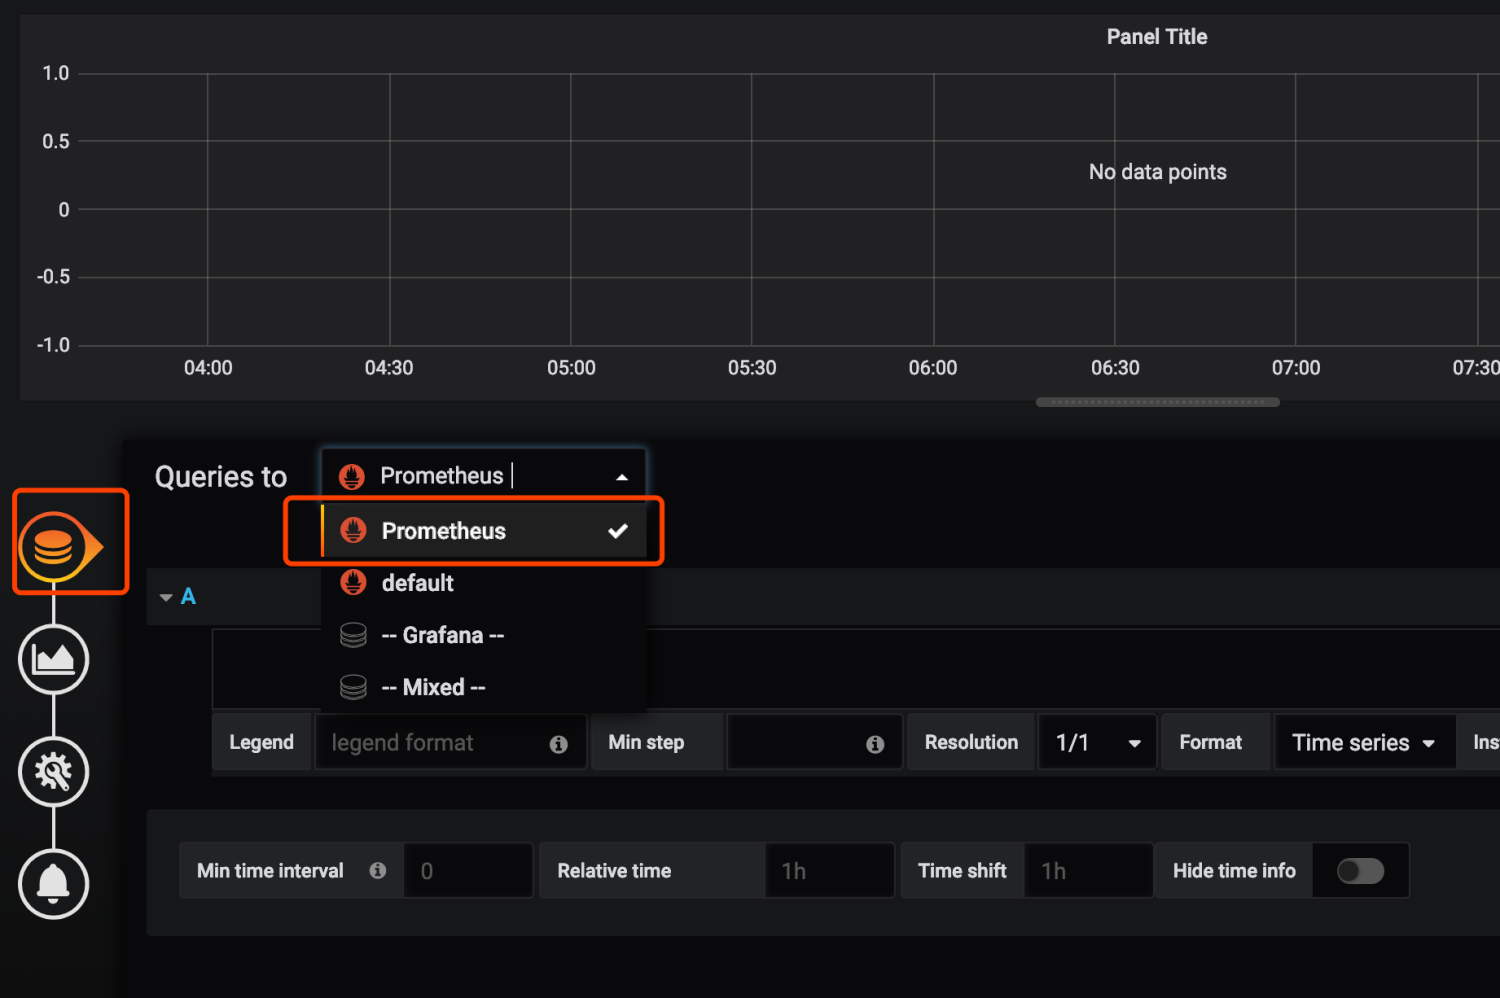
指定自己想看的指标和关键字,右上角保存
看到如下数据
到这里我们就已经实现了数据的自动收集和展示,下面来说下prometheus如何自动报警
(9) 安装AlterManager
Pormetheus的警告由独立的两部分组成。
Prometheus服务中的警告规则发送警告到Alertmanager。
然后这个Alertmanager管理这些警告。包括silencing, inhibition, aggregation,以及通过一些方法发送通知,例如:email,PagerDuty和HipChat。
建立警告和通知的主要步骤:
- 创建和配置Alertmanager
- 启动Prometheus服务时,通过-alertmanager.url标志配置Alermanager地址,以便Prometheus服务能和Alertmanager建立连接。
创建和配置Alertmanager
mkdir -p /home/chenqionghe/promethues/alertmanager
cd !$
创建配置文件alertmanager.yml
global:
  resolve_timeout: 5m
route:
  group_by: ['cqh']
  group_wait: 10s #组报警等待时间
  group_interval: 10s #组报警间隔时间
  repeat_interval: 1m #重复报警间隔时间
  receiver: 'web.hook'
receivers:
  - name: 'web.hook'
    webhook_configs:
      - url: 'http://10.211.55.2:8888/open/test'
inhibit_rules:
  - source_match:
      severity: 'critical'
    target_match:
      severity: 'warning'
    equal: ['alertname', 'dev', 'instance']
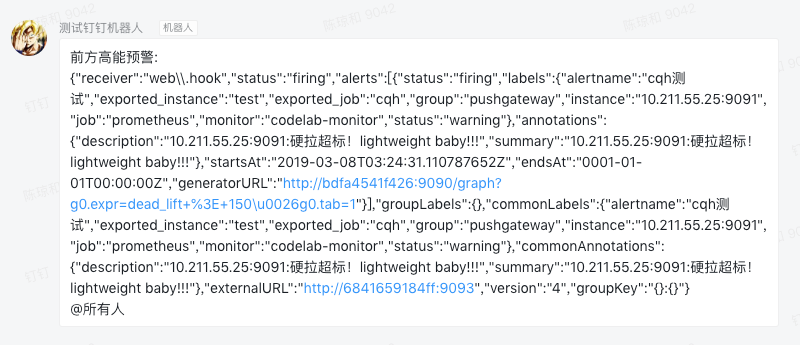
这里配置成了web.hook的方式,当server通知alertmanager会自动调用webhook http://10.211.55.2:8888/open/test
下面运行altermanager
docker rm -f alertmanager
docker run -d -p 9093:9093 \
--name alertmanager \
-v /home/chenqionghe/promethues/alertmanager/alertmanager.yml:/etc/alertmanager/alertmanager.yml \
prom/alertmanager
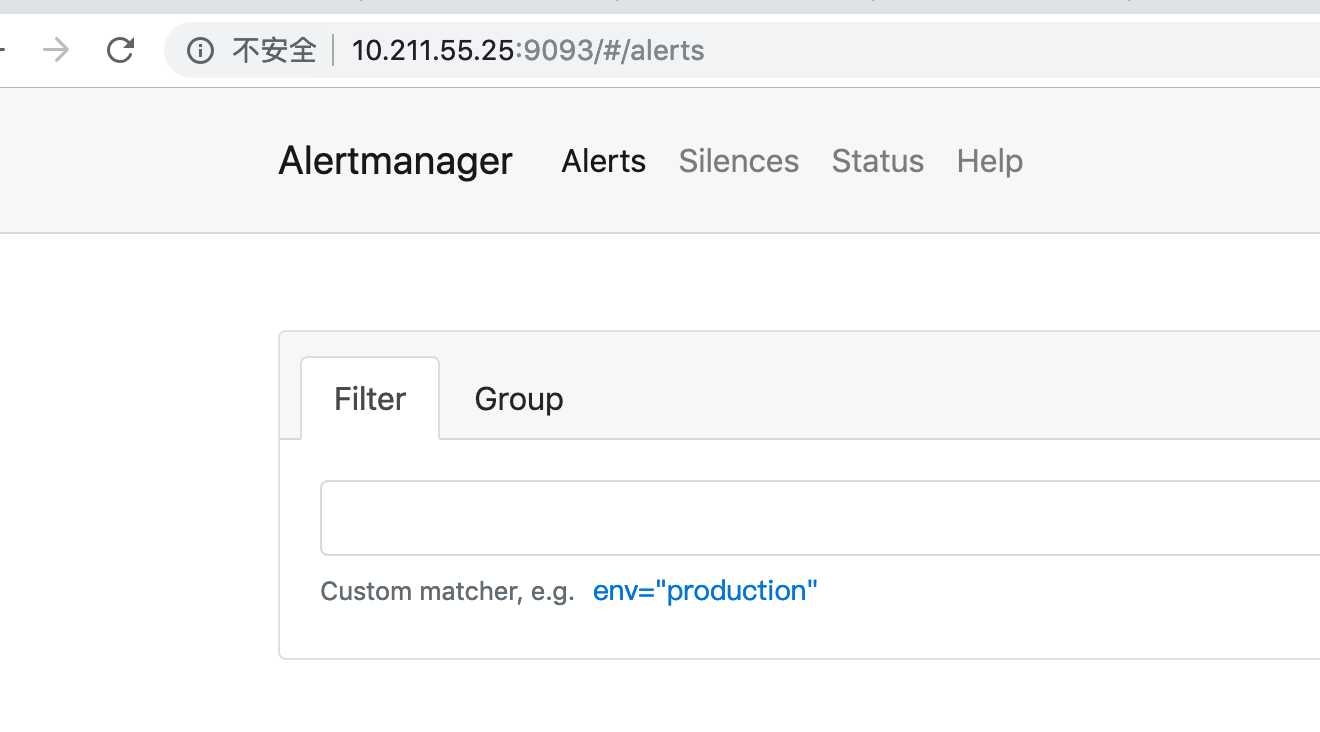
访问http://10.211.55.25:9093
接下来修改Server端配置报警规则和altermanager地址
修改规则/home/chenqionghe/promethues/server/rules.yml
groups:
- name: cqh
rules:
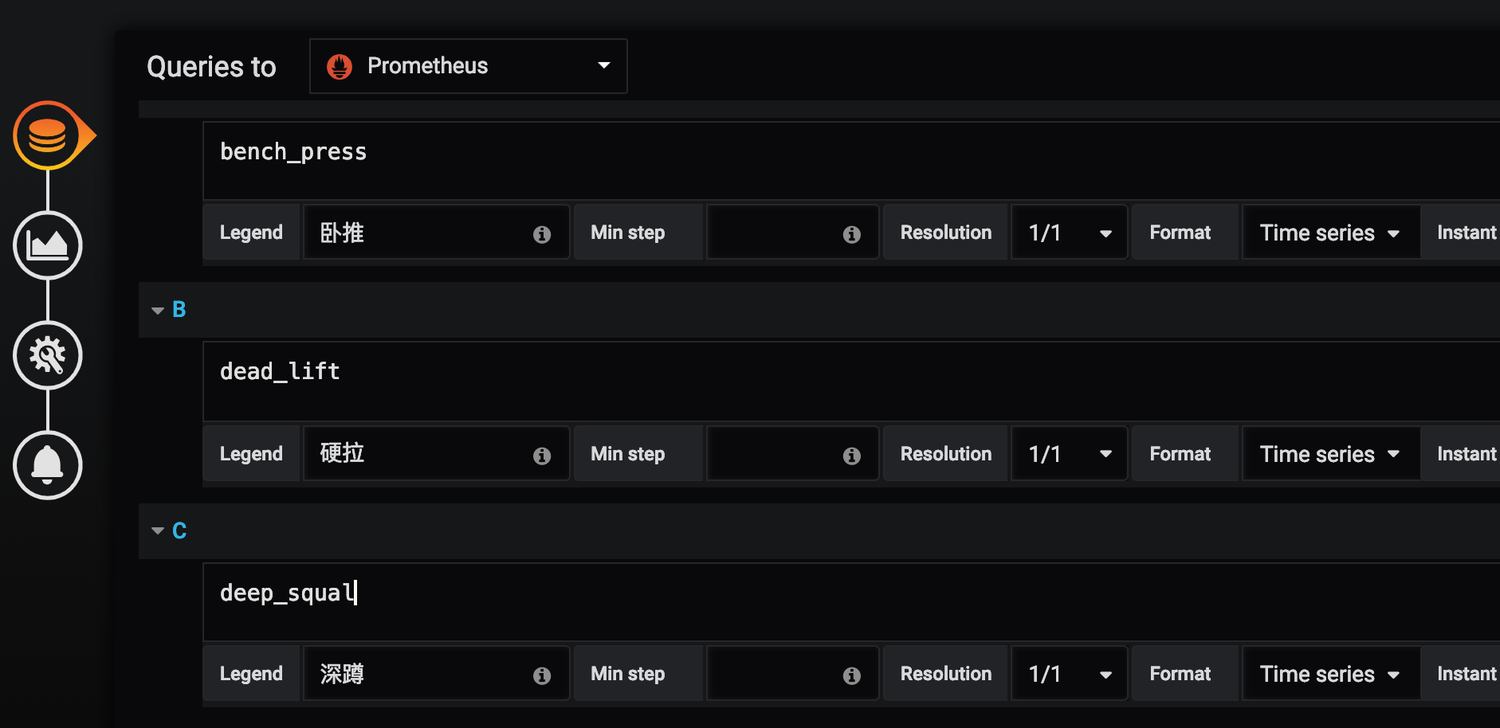
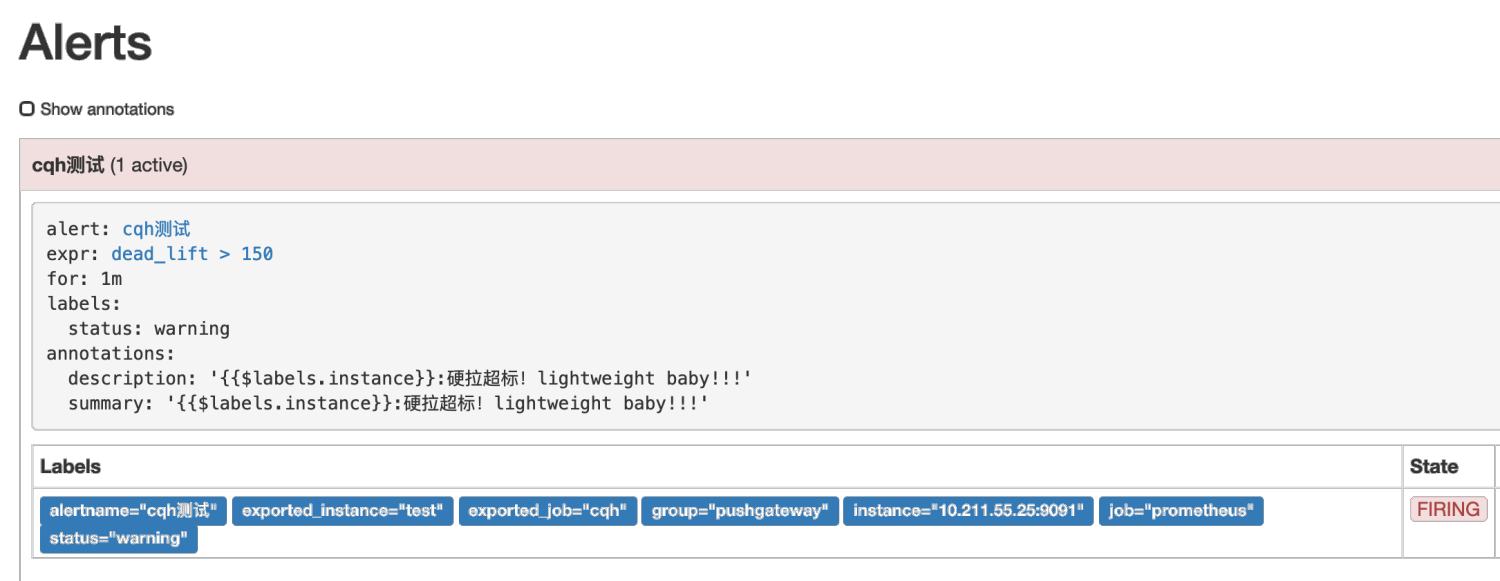
- alert: cqh测试
expr: dead_lift > 150
for: 1m
labels:
status: warning
annotations:
summary: ":硬拉超标!lightweight baby!!!"
description: ":硬拉超标!lightweight baby!!!"
这条规则的意思是,硬拉超过150公斤,持续一分钟,就报警通知
然后再修改prometheus添加altermanager配置
global:
  scrape_interval:     15s # 默认抓取间隔, 15秒向目标抓取一次数据。
  external_labels:
    monitor: 'codelab-monitor'
rule_files:
  - /etc/prometheus/rules.yml
# 这里表示抓取对象的配置
scrape_configs:
  #这个配置是表示在这个配置内的时间序例,每一条都会自动添加上这个{job_name:"prometheus"}的标签  - job_name: 'prometheus'
  - job_name: 'prometheus'
    scrape_interval: 5s # 重写了全局抓取间隔时间,由15秒重写成5秒
    static_configs:
      - targets: ['localhost:9090']
      - targets: ['10.211.55.25:8080', '10.211.55.25:8081','10.211.55.25:8082']
        labels:
          group: 'client-golang'
      - targets: ['10.211.55.25:9100']
        labels:
          group: 'client-node-exporter'
      - targets: ['10.211.55.25:9091']
        labels:
          group: 'pushgateway'
alerting:
  alertmanagers:
    - static_configs:
        - targets: ["10.211.55.25:9093"]
重载prometheus配置,规则就已经生效
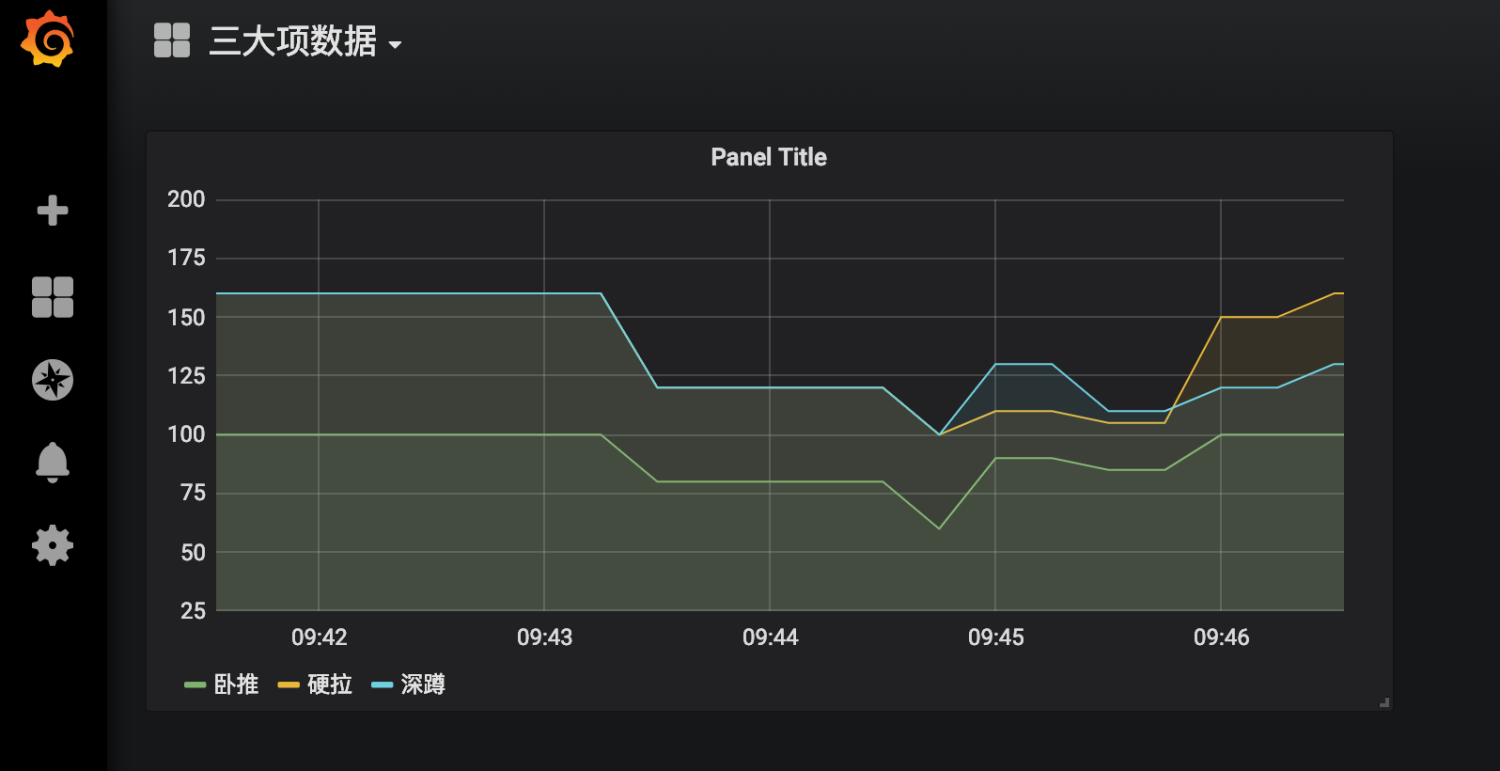
接下来我们观察grafana中数据的变化
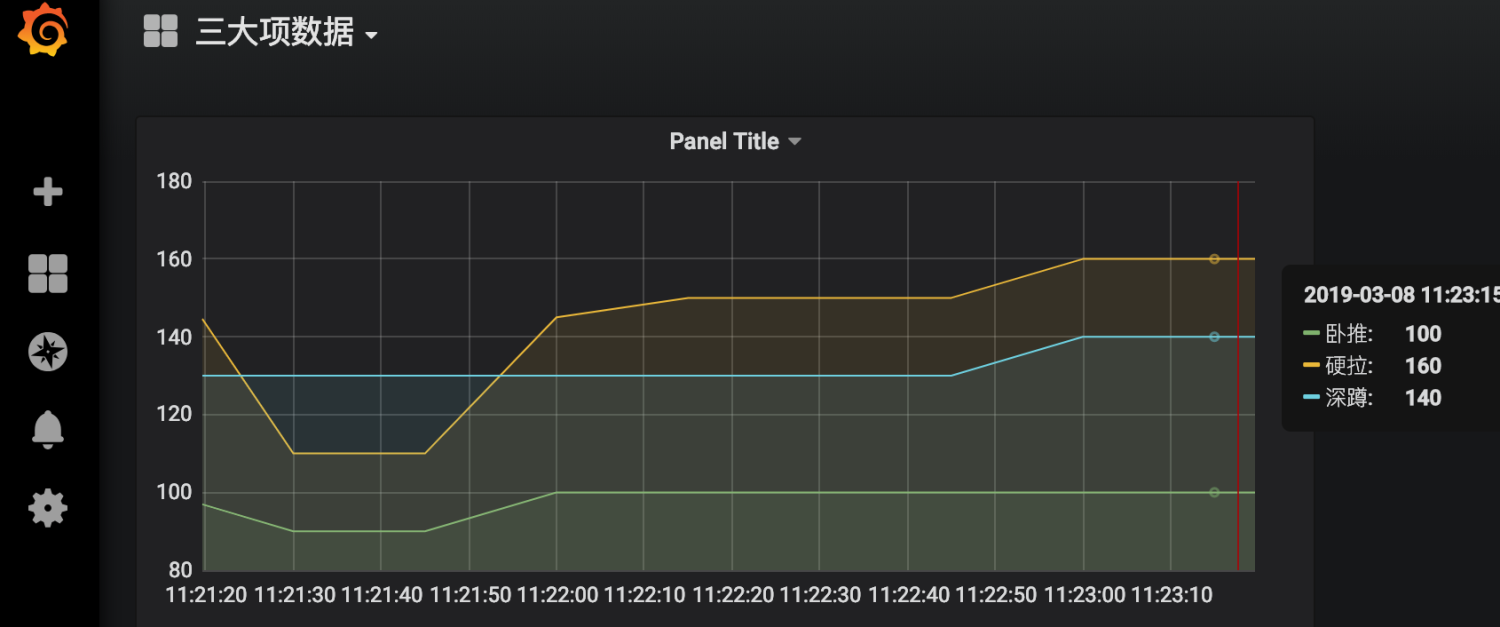
然后我们点击prometheus的Alert模块,会看到已经由绿->黄-红,触发了报警
然后我们再来看看提供的webhook接口,这里的接口我是用的golang写的,接到数据后将body内容报警到钉钉
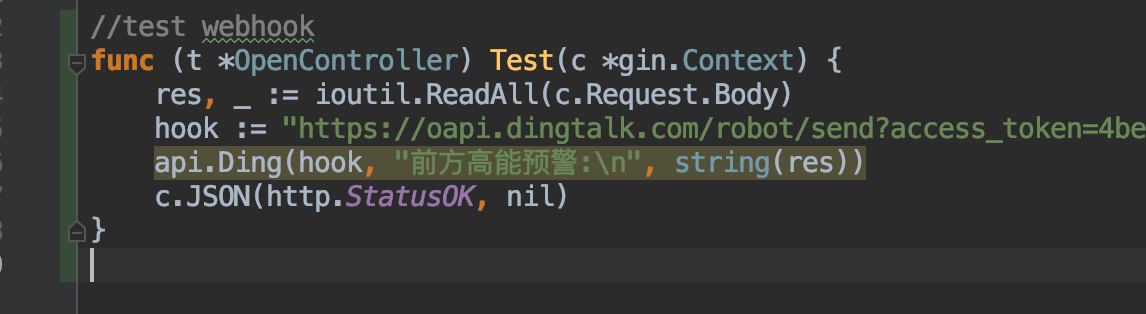
钉钉收到报警内容如下